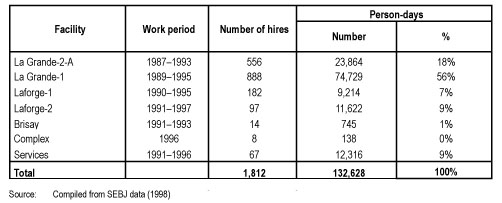
According to SEBJ data, there were 1,812 hires between 1987 and 1997, for a total of 132,628 person-days of work. As the SEBJ data does not distinguish between Cree workers and other native workers hired by non-Cree contractors, it is possible that the hiring data includes a few non-Cree Native workers, namely Naskapis.
In absolute numbers, these results are inferior to those of Phase I. However, given that Phase II cost 2.5 times less than Phase I and that the types of work carried out were generally more specialized, they reflect the fact that Cree companies and the Cree workforce are increasingly able to participate in hydroelectric development in the territory.
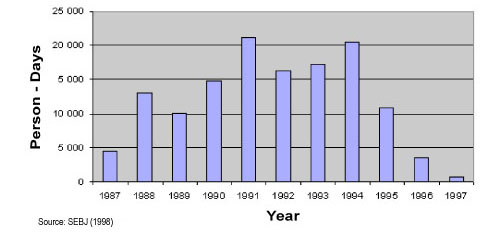
The number of annual hires peaked in 1992, when 310 Cree workers were employed at various James Bay jobsites. The highest number of person-days worked (21,193) was recorded in 1991.
According to SEBJ data (1998), almost 90% of those hired were residents of Chisasibi. Moreover, Cree workers were especially present at the La Grande2A and La Grande1 jobsites, having logged 74% of the total number of person-days worked.
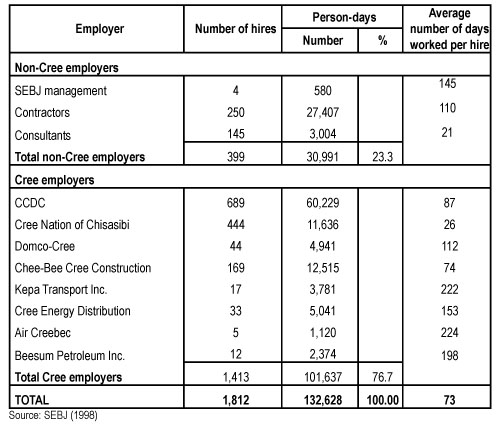
Non-Cree employers generated 23.3% of the total volume of Cree employment in Phase II, with 30,991 person-days. Of all Cree employers, the CCDC had the highest number of jobs, with 689 hires and 60,229 person-days of work. The other main employers were Chee-Bee Cree Construction and the Cree Nation of Chisasibi (8.8%). The average duration of employment was 73 days for all workers, but was longer for service companies (Kepa Transport, Cree Energy Distribution, Air Creebec, Domco-Cree and Beesum Petroleum) with an average of 157 days.
(one hire is equivalent to one person recruited within a sigle year. Thus, if the same person is recruited for a summer job two years runningm it counts as two hires) |