
Dynamic pricing results
Dynamic pricing was launched on December 1, 2019. Since that time, it has been rolled
out gradually to provide optimum support to customers.
We are proud of the
participants. Highly motivated, they take action to save money and decrease
electricity demand during peak demand events. The results of their efforts are
outlined below.
2022-2023 highlights

About228,000 participating customers
Electricity demand reduced by206 MW per peak demand event
Average electricity demand per customer reduced by0,9 kWper peak demand event
Winter Credit Option
Participants received credits totalling about $5.6 million, or an average credit of about $27 per customer.
Customers who were actively involved and adopted the good practices outlined in our tips saved an average of $71,40.
Flex rates
Participants received savings totalling about $2,931,573, or an average of $114 per customer.
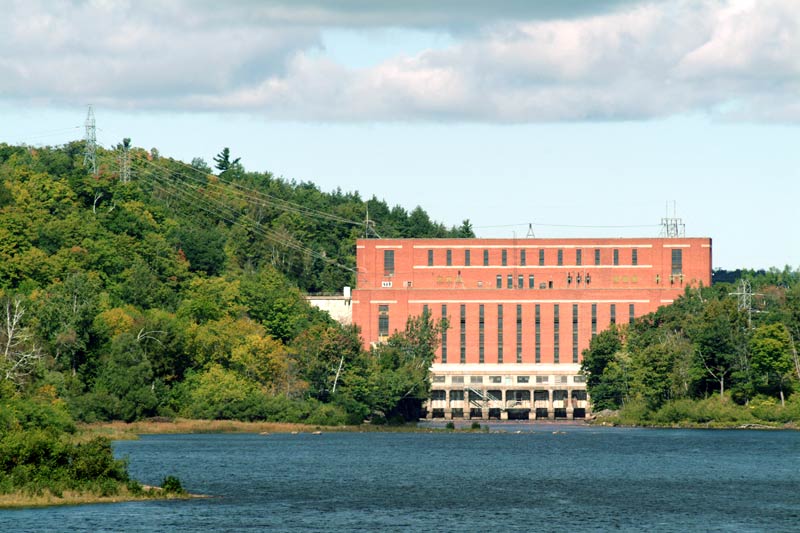
Interesting fact: The 206 MW reduction in electricity demand represents about the equivalent of the total power generated by the Rapide‑Blanc generating station on Rivière Saint-Maurice.
Summary per season
Winter 2022-2023
| Number of participating customers | About 228,000 |
|---|---|
| Total curtailed power | 206 MW per peak demand event |
| Number of customers corresponding to the curtailed power | 29,400 residential customers per peak demand event |
| Number of participating customers | About 202,000 |
|---|---|
| Number of peak demand events | 18 |
| Overall credit issued to customers | About $5,629,905 |
| Average credit per customer | About $27 |
| Number of participating customers | About 26,000 |
|---|---|
| Number of peak demand events | 16 |
| Overall savings | About $2,931,573 |
| Average savings per customer | About $114 |
Winter 2021-2022
| Number of participating customers | About 157,000 |
|---|---|
| Total curtailed power | 157 MW per peak demand event |
| Number of customers corresponding to the curtailed power | 22,500 residential customers per peak demand event |
| Number of participating customers | About 141,000 |
|---|---|
| Number of peak demand events | 29 |
| Overall credit issued to customers | About $6,773,546 |
| Average credit per customer | About $46 |
| Number of participating customers | About 16,000 |
|---|---|
| Number of peak demand events | 26 |
| Overall savings | About $903,683 |
| Average savings per customer | About $55 |
Winter 2020-2021
| Number of participating customers | About 61,000 |
|---|---|
| Total curtailed power | 65 MW per peak demand event |
| Number of customers corresponding to the curtailed power | 9,300 residential customers per peak demand event |
| Number of participating customers | About 53,000 |
|---|---|
| Number of peak demand events | 22 |
| Overall credit issued to customers | About $2,105,302 |
| Average credit per customer | $40 |
| Number of participating customers | About 8,000 |
|---|---|
| Number of peak demand events | 27 |
| Overall savings | About $400,000 |
| Average savings per customer | $48 |
Winter 2019-2020
| Number of participating customers | About 20,000 |
|---|---|
| Total curtailed power | 16 MW per peak demand event |
| Number of customers corresponding to the curtailed power | 2,300 residential customers per peak demand event |
| Number of participating customers | About 17,400 |
|---|---|
| Number of peak demand events | 21 |
| Overall credit issued to customers | About $500,000 |
| Average credit per customer | $28 |
| Number of participating customers | About 2,400 |
|---|---|
| Number of peak demand events | 24 |
| Overall savings | About $150,000 |
| Average savings per customer | $62 |