Understanding your standard bill
Select the rate for which you would like to view an example of a bill.
Select the rate for which you would like to view an example of a bill.
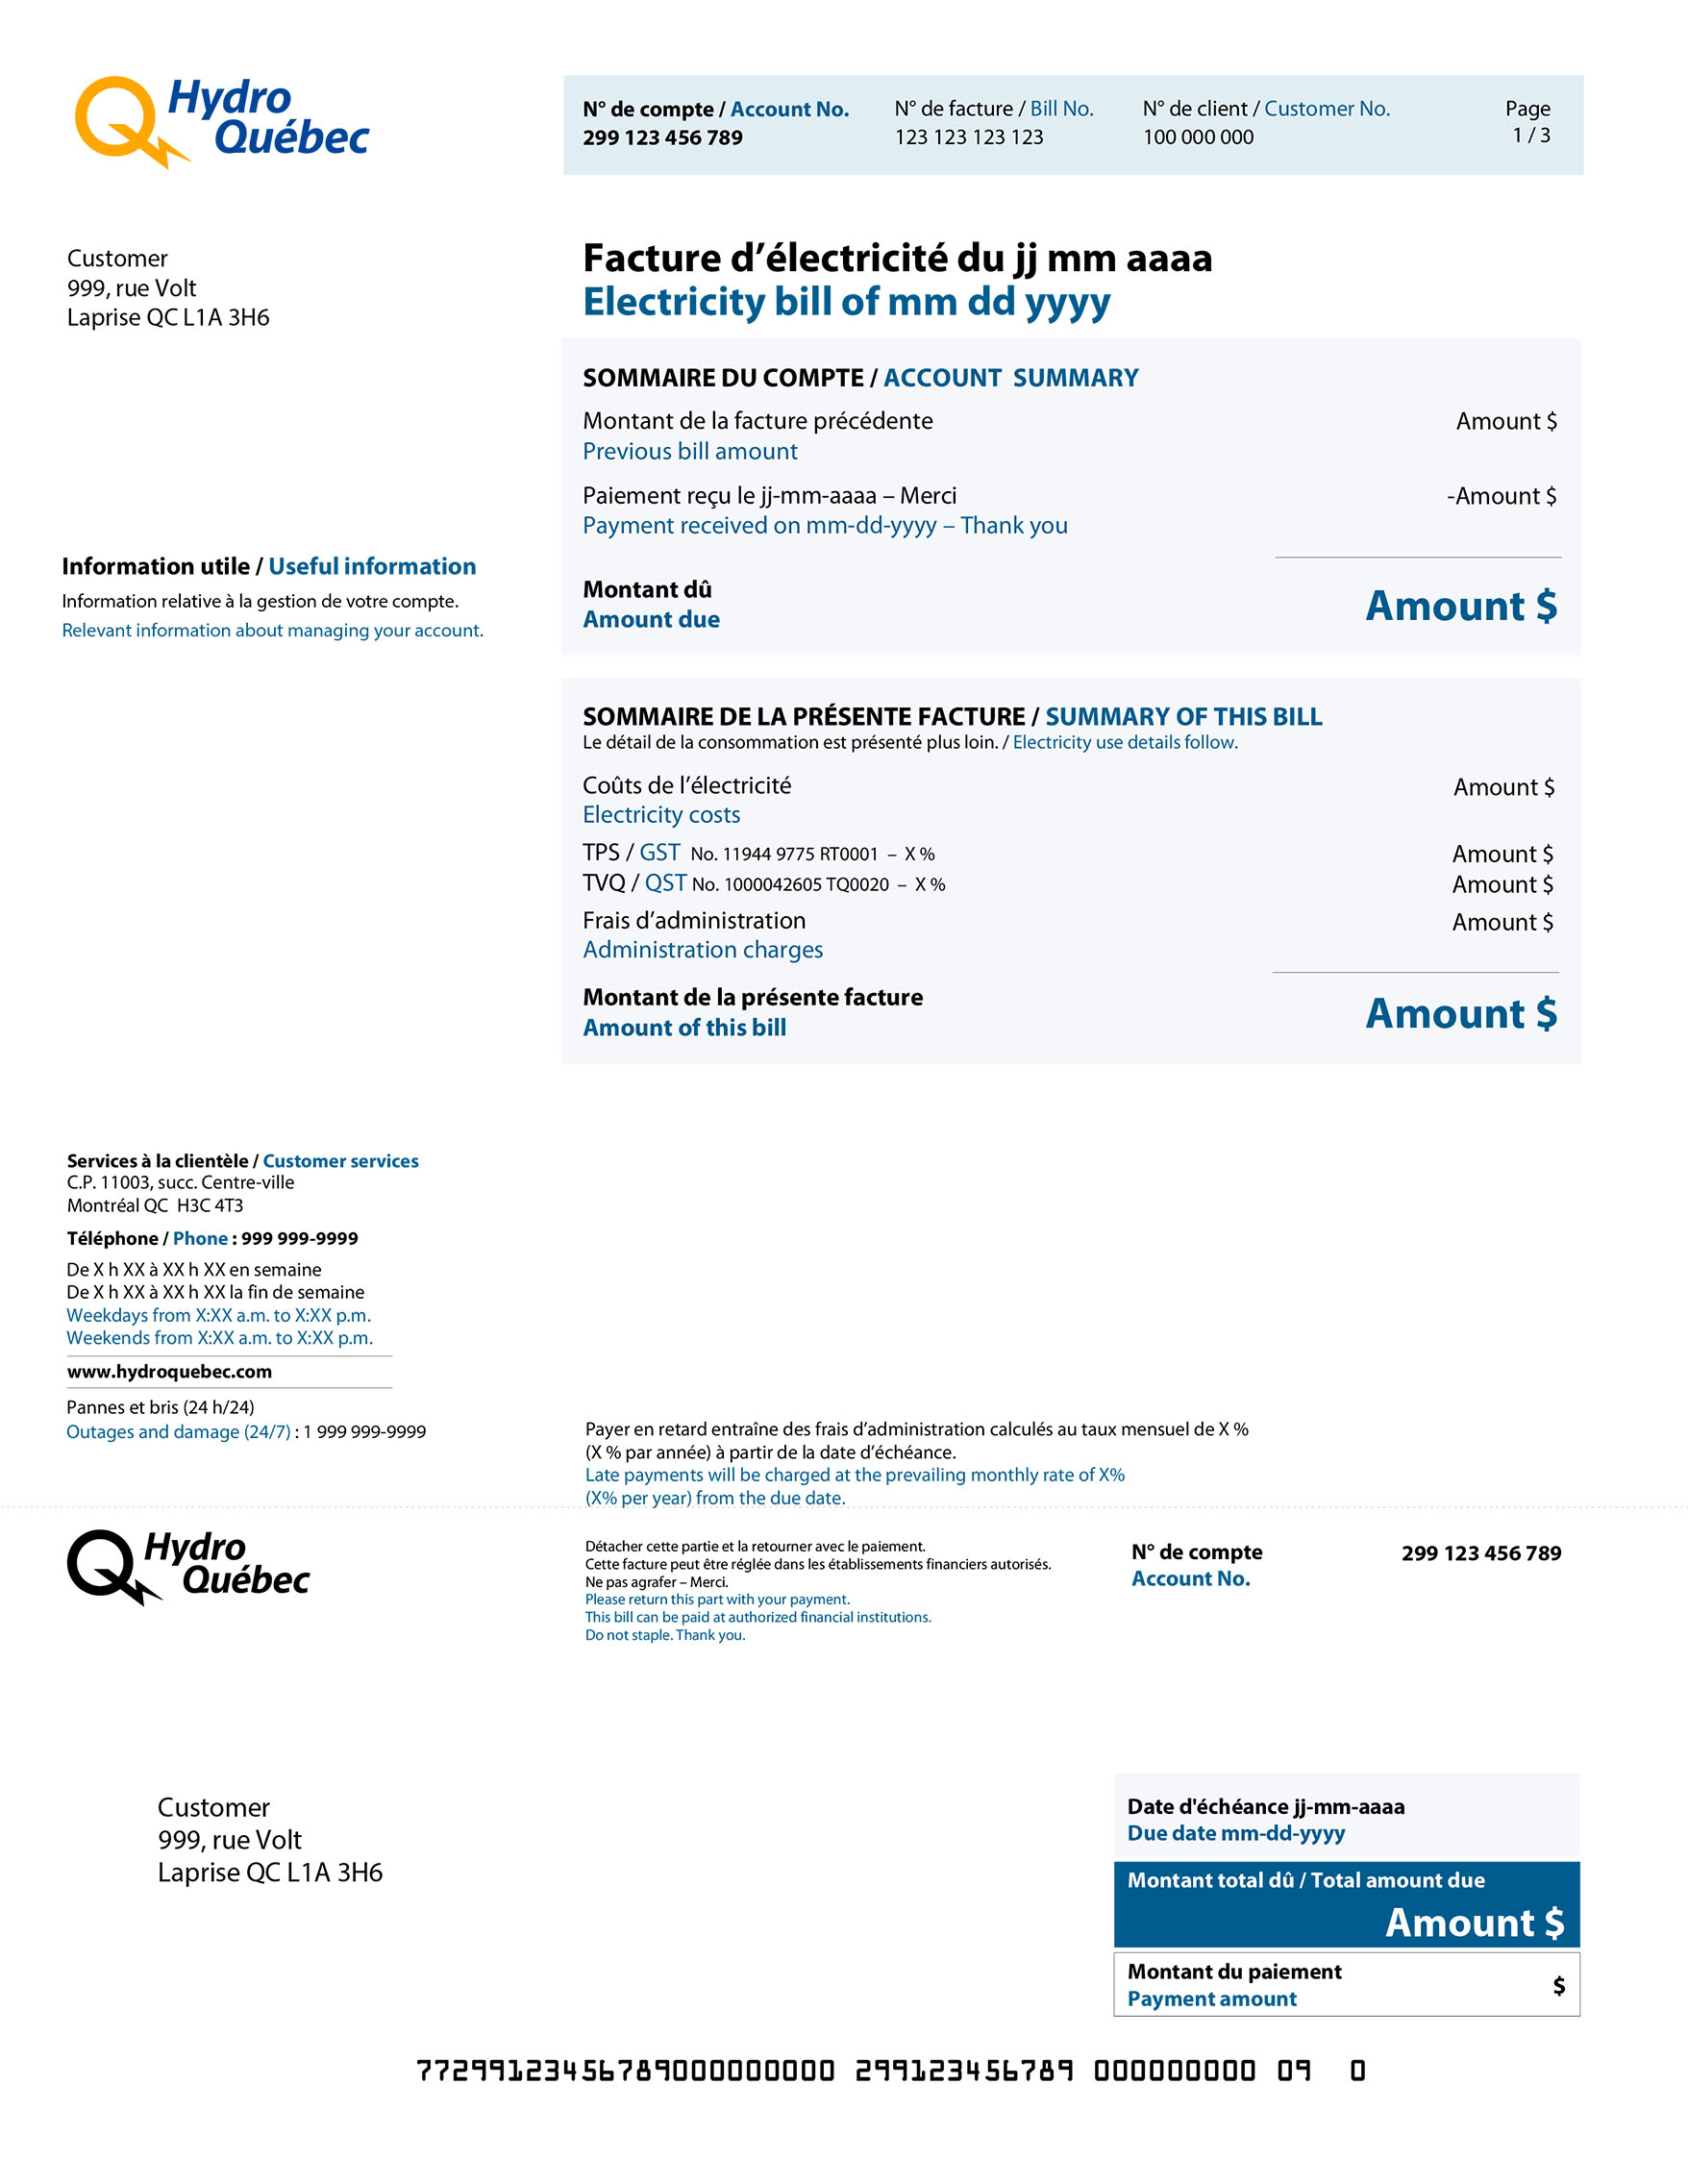
Every bill is different. That’s because the total amount due depends on how much electricity you’ve actually used.

Transactions since your last bill: amount of last bill, payments made, credits and amount due.
Message of general interest or information about our services.
Electricity costs, taxes, charges (if any) and amount of bill.
Total amount due and due date.
Return the stub with your payment if you pay by mail.

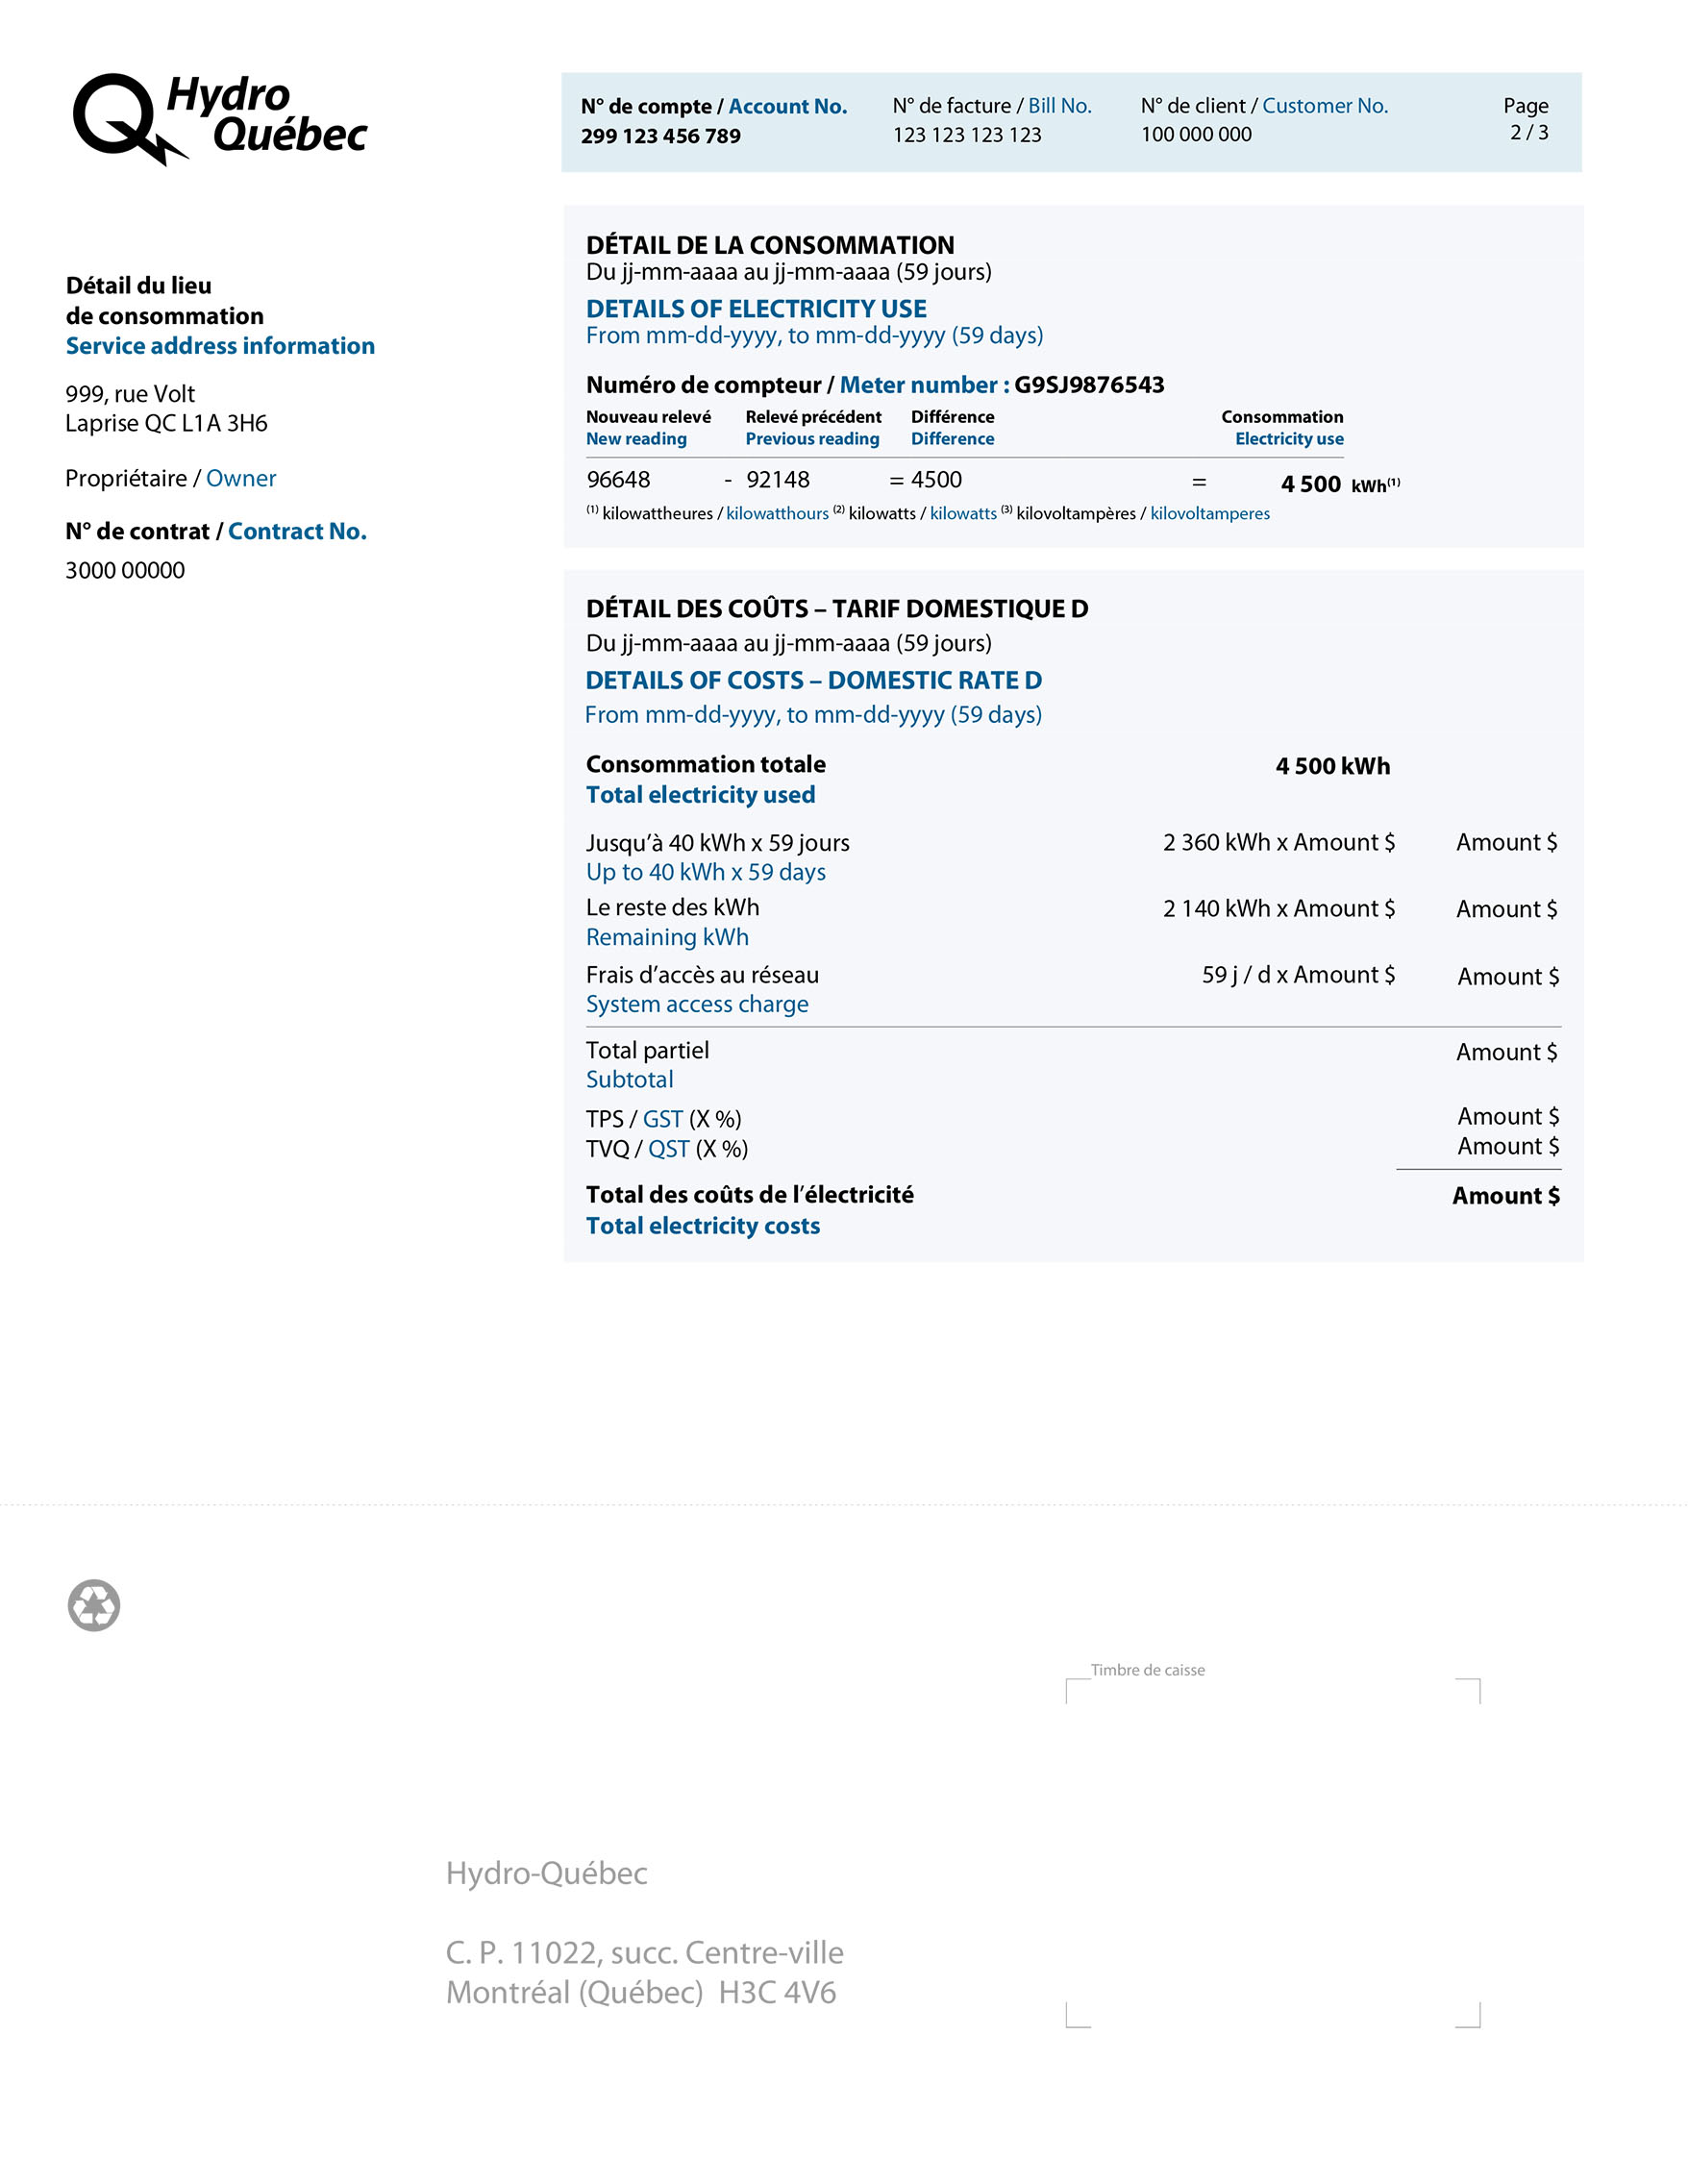
Service address, contract holder and contract number.
Period covered by this bill, number of days, meter serial number, meter-reading data and calculation of amount of electricity used.
In the example: New meter reading (96648) − previous reading (92148) = kilowatthours used (4 500)
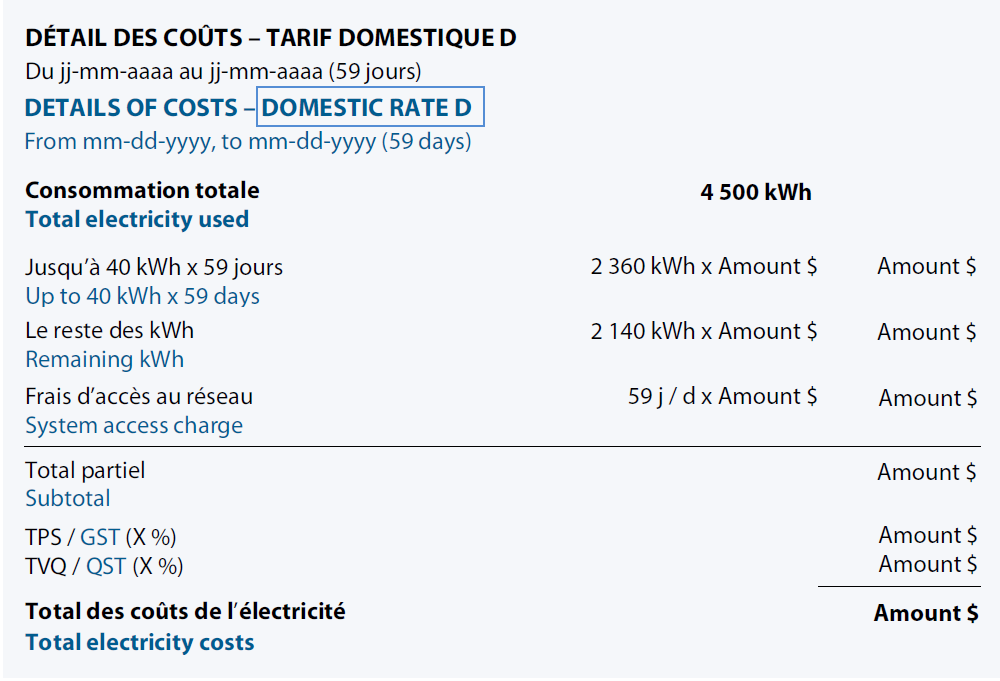
Detailed calculation of the cost of electricity used, based on applicable rates and number of days, along with any credits or other charges (if applicable) plus taxes. The total is carried over to page 1, under the heading Summary of this bill.
Kilowatthours used in billing period = 4 500 kWh
Energy used, up to the product of 40 kWh times the number of days in the billing period (1st tier). The total of 2 360 kWh is calculated as follows:
40 kWh × 59 days (days in billing period)
Electricity used beyond first tier (2nd tier). Here’s how it’s calculated:
4 500 kWh (kilowatthours used) − 2 360 (kilowatthours calculated in 1st tier) = 2 140 kWh
The system access charge is the amount you pay for the service itself, regardless of how much electricity you use. Here’s how it’s calculated:
System access charge per day x 59 days (billing period)

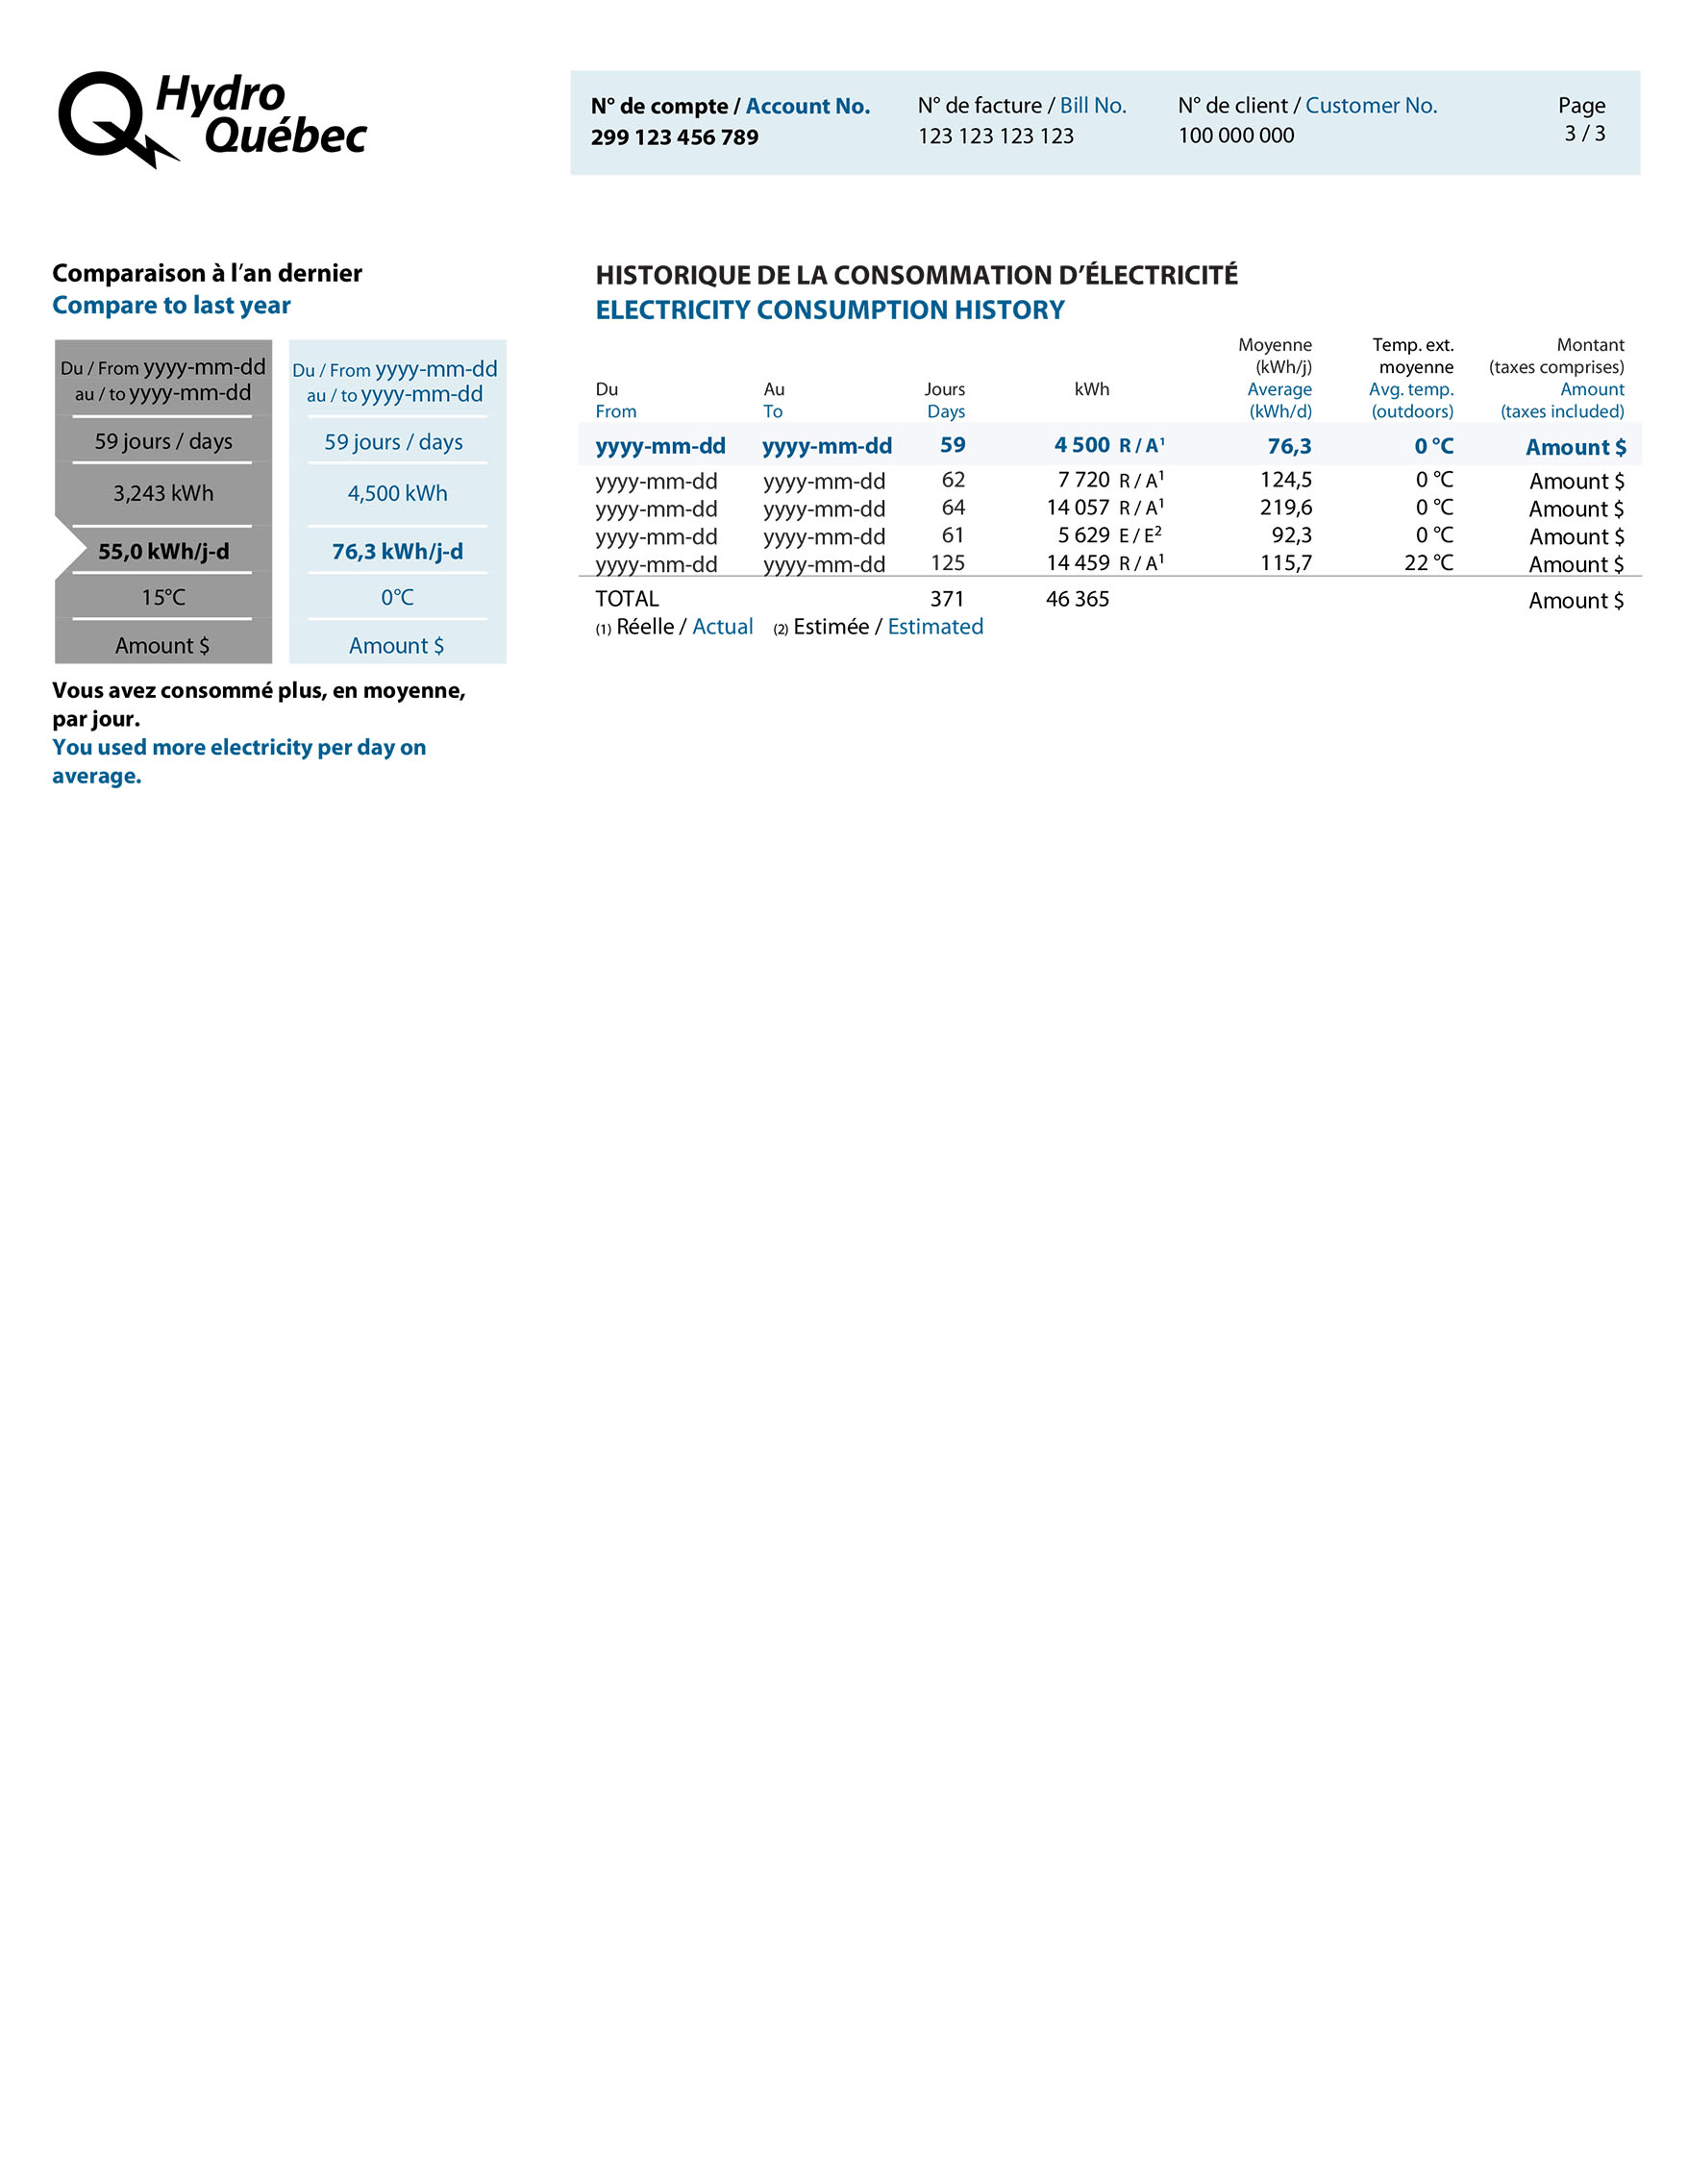
New table that compares a number of variables with the same period last year: number of days in period, total electricity use, average daily use, average outdoor temperature and electricity cost.
A personalized message tells you whether your average daily electricity use is higher, lower or similar to that of the same period last year.
You can see your electricity use in kilowatthours or in dollars and note how it changes from hour to hour using the Energy Performance Indicator in your Customer Space.
Information on your electricity use over the past year. The table now gives the average outdoor temperature in your region to show how the weather affects your electricity use, if you heat with electricity.
Every bill is different. That’s because the total amount due depends on two factors: how much electricity you’ve actually used and the outdoor temperature
Here’s an example of a bill for a Rate DT contract up to 50 kilowatts (no demand charge):

Transactions since your last bill: amount of last bill, payments made, credits and amount due.
Message of general interest or information about our services.
Electricity costs, taxes, charges (if any) and amount of bill.
Total amount due and due date.
Return the stub with your payment if you pay by mail.

Service address, contract holder and contract number.
Period covered by this bill, number of days, meter serial number, meter-reading data and calculation of amount of electricity used.
In the example:
Detailed calculation of the cost of electricity used, based on applicable rates and number of days, along with any credits or other charges (if applicable) plus taxes. The total is carried over to page 1, under the heading Summary of this bill.
Kilowatthours used in billing period = 15,443 kWh
Electricity used when the temperature is below –12°C, or –15°C in some areas, multiplied by the highest rate price during the period. If there is no electricity use when the price is highest during the period, only electricity use at the lowest price will appear on the bill.
Electricity used when the temperature is below –12°C, or –15°C in some areas, multiplied by the lowest rate price.
The system access charge is the amount you pay for the service itself, regardless of how much electricity you use. Here’s how it’s calculated:
System access charge per day x 62 days (billing period)

Table that compares a number of variables with the same period last year: number of days in period, total electricity use, average daily use, average outdoor temperature and electricity cost.
A personalized message tells you whether your average daily electricity use is higher, lower or similar to that of the same period last year.
You can see your electricity use in kilowatthours or in dollars and note how it changes from hour to hour using the Energy Performance Indicator in your Customer Space.
Information on your electricity use over the past year. The table gives the average outdoor temperature in your region to show how the weather affects your electricity use, if you heat with electricity.
The rate you pay is indicated on your bill beside the Details of electricity cost heading.
