Comparison of electricity prices
Every year, Hydro‑Québec compares the monthly electricity bills of Québec residential, commercial, institutional and industrial customers with those of customers of the various utilities serving 21 major North American cities.
The figures below show a comparison of electricity average prices for four consumption levels in major North American cities.
Average prices for electricity (¢/kWh)
Consumption: 10,000 kWh/month
Power demand: 40 kW
- Winnipeg, MB 9.69
- Montréal, QC 11.66
- Vancouver, BC 12.24
- Toronto, ON 14.86
- Miami, FL 16.36
- New York, NY 43.62
- Boston, MA 46.19
Consumption: 100,000 kWh/month
Power demand: 500 kW
Consumption: 400,000 kWh/month
Power demand: 1,000 kW
Consumption: 3,060,000 kWh/month
Power demand: 5,000 kW
Voltage: 25 kV
Rates in effect April 1, 2024.
Average prices excluding taxes.
In Canadian currency.
Detailed report | 2024 Edition

- Comparison of Electricity Prices in Major North American Cities [PDF 673 KB]
This document is published annually.
Inflation and trends in energy prices in Québec
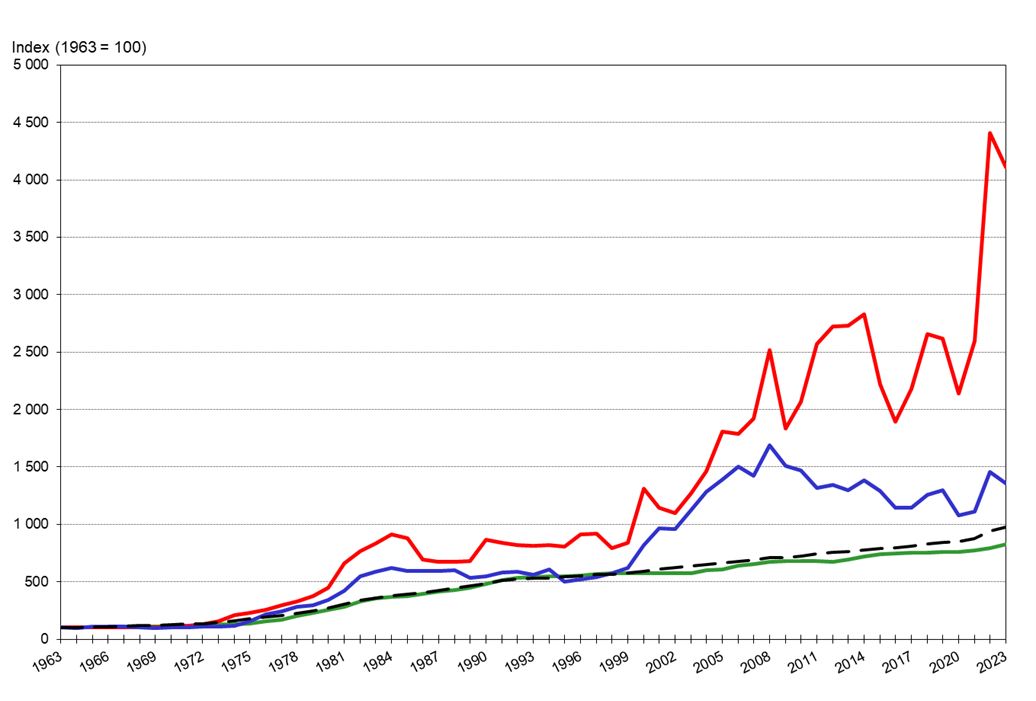
1963-2023

- The red line represents the growth in the price of Oil
- The blue line represents the growth in the price of Gas
- The green line represents the growth of Electricity
-
The dotted line represents Consumer Price
Index (CPI)
This graph illustrates inflation rates and energy prices in Québec from 1963 to 2023. Electricity prices follow the inflation curve while oil and natural gas prices show greater fluctuations. Based on information available to date, the Canadian consumer price index is 975. The price index for electricity is 828, compared to 1,355 for natural gas and 4,109 for oil.
Sources: Hydro‑Québec, Régie de l'énergie, Bloomberg Oil Buyer's Guide and Statistics Canada (2023 data for oil and gas).
Offers and programs that help business customers use less electricity, consume it at the right time and save money.
Dynamic pricing – Rate G customers
Energy efficiency and demand response offers and programs to save on your electricity bill and optimize your electricity use